Measurement Data Processing and Data Presentation
Measurement Data Processing and Data Presentation
The following texts are the property of their respective authors and we thank them for giving us the opportunity to share for free to students, teachers and users of the Web their texts will used only for illustrative educational and scientific purposes only.
The information of medicine and health contained in the site are of a general nature and purpose which is purely informative and for this reason may not replace in any case, the council of a doctor or a qualified entity legally to the profession.
![]()
Measurement Data Processing and Data Presentation
Chemistry
Experimental errors and uncertainty
An essential part of Science is measuring. Chemists ask questions like: How much? How many? How hot? How pure? How fast? How far? However, it must be appreciated that in all measurement there is always some error present. As the word 'error' implies some form of mistake, it is probably wiser to use the word 'uncertainty' when discussing experimental measurements. Even the most experienced and skilled operator will make measurements that have a degree of uncertainty and this is the 'experimental error'.
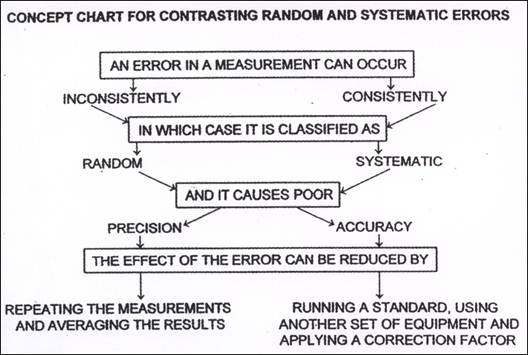
Knowing where, when and how errors may occur enables the experimenter to reduce their incidence and therefore their significance. The first way to manage possible experimental errors is to classify them. Chemists consider two types:
● random errors and
● systematic errors
A third category is procedural errors, where for example, glassware has not been washed, a closed system has been heated and an explosion occurs or some product is knocked onto the floor.
Random errors
Random errors occur inconsistently. In a single experiment a random uncertainty causes the recorded measurement to be larger or smaller than the true value, and by varying amounts. There are many, many possible sources of this type of error which include slight changes in experimental technique, ambient, i.e. surrounding conditions (temperature, light and air movement) and reactant characteristics. Because these uncertainties occur randomly, their effects can be reduced by repeating the experiment and then averaging the results.
Because random uncertainties cause the result to fluctuate up and down from the true value, they are often quantified using a +/- symbol. Some laboratory instruments quote this uncertainty. For example, a volumetric pipette will often have written on it the volume it measures, along with the uncertainty range according to the manufacturer – for example 25. 0 mL +/- 0.1 mL. This means the value will lie somewhere in between 24.9 and 25.1 mL, assuming the experimenter has good pipetting technique.
Systematic errors
Systematic errors occur because of a regular fault present in the experiment. This is usually due to a regular fault present in the ‘system’ i.e. the measuring device used in the experiment or possibly due to a chemist’s technique. In a single experiment a systematic error will cause the result to be either larger or smaller than the true value and by a fixed amount. Repetition of the experiment will not reduce the effect of systematic errors because they always skew the result in the same direction and by the same amount. A common example of this is the use of incorrectly calibrated scales. If you are weighing out a 2 g sample of a reactant and the scales read 2.0 g when in fact the mass of the sample is 2.3 g, then the use of these scales will always result in an extra, undetectable mass of 0.3 g for the experiment. Repeating the experiment will not reduce this error because it will always be present in the same direction (more mass than required) by the same amount (0.3 g). Systematic errors are therefore not always easy to identify because even when repeating the experiment, the results will agree as they will deviate by the same amount.
In September 1999 NASA lost a lander on Mars worth US$150 million because the engineers used pounds for the impulse force to adjust its orbit instead of newtons (1 lb of force = 4.45 N). Thus the impulse force was low by a factor of four and as a result, the lowest part of the orbit became 57 km instead of the planned 266 km. This was too low for spacecraft survival and so this systematic error was an astronomical blunder!
Precision and accuracy
Combined, the extent of random and systematic errors affect how confident a chemist can be of his or her results. We define this confidence in terms of precision and accuracy.
Precision and random errors
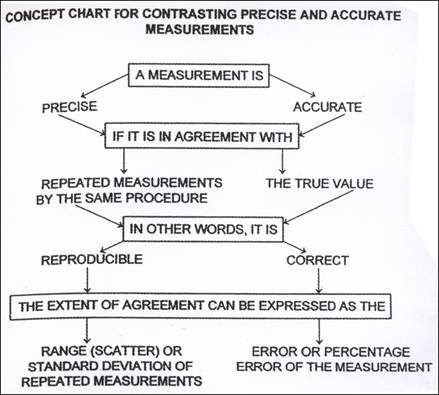
Precise measurements are those that are very close to each other or that are measured very exactly. The mass measurements 4.19 g, 4.17 g and 4.18 g are very close to each other and this indicates that these results are precise. Each of these values also has three significant figures and they are therefore more precise than values with fewer significant figures such as 4.1 g or simply 4 g, measured on less precise scales. Random uncertainties affect the precision of measurements because they can cause these measurements to be randomly scattered rather than close together. A precise measurement is one that is free of random errors.
Accuracy and systematic errors
Accurate measurements are ones that are close to the true value. Looked at individually they may not be close, but when averaged, their mean is very close to the true value. For example, a person might have an actual mass of 70 kg. When weighed three times the following values are obtained: 65 kg, 70 kg, & 75 kg. The measurement of 70 kg is accurate as it is the true value. Individually the measurements of 65 kg are not accurate, but when combined, the average of the three is 70 kg, making the group of measurements accurate overall. Systematic errors affect the accuracy of measurements because they can cause these measurements to lie away from the true value by a fixed amount. An accurate measurement is one that is free of systematic errors.
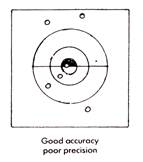
The bullseye diagrams below provide a good representation of precision and accuracy. Results may be accurate but not precise, precise but not accurate, neither accurate nor precise or both precise and accurate (the desired outcome). Being able to identify results clearly in these terms is a very important skill for a chemist to have.
|
|
|
|
It is important to consider both random and systematic errors and precision and accuracy because a chemist's results can only be as certain as the data they rely on. It is therefore essential to minimise the possible sources of error.
Data processing
When adding or subtracting measurements, the result should be quoted to the smallest number of decimal places that is found in the data. For example when adding two lengths together such as 12.98 m and 8.2 m, the second measurement has the smaller number of decimal places (only one). Therefore although the number on the calculator appears as 21.18 m it is quoted as 21.2 m because it is recognised that the number in the second decimal place is uncertain.
When multiplying or dividing measurements, the result should be quoted with the smallest number of significant figures that is found in the data. For example, when multiplying those two same lengths the calculator gives the answer 106.436 m2. However the data value 8.2 m has only two significant figures. Therefore the answer is quoted as 110 m2.
Accuracy - used to describe how close a measurement is to an accepted value.
The precision of a measurement refers to how reproducible this measurement is.


Graphical Techniques
Often when a chemist is working with a lot of data, it is simpler to represent this data in graph form rather than just as rows of numbers. Graphs and charts are much used because they visually communicate a considerable amount of information. For this reason they can be found in most newspapers and magazines. They can be found in the form of bar, line or area graphs and in pie charts. Without checking the scales used, they can appear to exaggerate or diminish trends.
Chemists use line graphs and these are referred to as line graphs even if they are curved. The relationships between variables are shown much more clearly than if you had to read the data through the data and tried to visualise it yourself. It is not only important to be able to interpret these relationships from a graph but also be able to draw them.
Data presentation - graphs
When drawing graphs keep the following in mind.
Dependent and independent variables
The independent variable (the one the experimenter actively changes) should always go on the X (horizontal) axis and the dependent variable (the one that is measured because it changes as a result of varying the independent variable) should always go on the Y (vertical) axis.
Graphs should be ● large. Make the maximum use of space
● labelled There must be a precise and explicit title that explains exactly what the
graph is depicting.
Both X & Y axes should be neatly labelled with both a quantity and unit, as well as
the scale (often SI) of the quantity represented.
●lead pencil Because mistakes can be made, lead pencil should be used for line
graphs - no furred or double lines please. Use your eraser.
●line of best fit The line of best fit should be smooth and constructed so that
approximately the same number of points lie above and below the line. The scatter
of the measured points above and below the line of best fit gives an indication of the
precision of the experiment but not the accuracy. Points that are extrapolated should
be shown with a dotted line to indicate that they were not measured but inferred.
Lines, if straight, should be ruled.


●scales Scales are chosen so that the data points can be easily plotted and read.
Usually one division should be 1, 2, 5 or 10 units if the spread of data is small, or a
multiple of 10 if the spread is large. The scales should be chosen to make it as easy
as possible to interpret the graph so that the data covers most of the area of the
graph. As such, the scales on the axes need not be the same, nor do both axes need
to start from zero.
Interpreting graphs
What is meant when one variable is directly proportional to another?
Proportionality is used to describe variables that have a linear relationship. It indicates that when one variable increases the other increases by the same magnitude. The graph above shows this relationship.
What is meant when one variable is inversely proportional to another?
When a variable is inversely proportional to another, it means that when one variable increases, the other decreases by the same magnitude. .
Conventionally, both axes increase - the values along the X axis increase from left to right and those along the Y axis increase from bottom to top. Because the variables are inversely proportional, as one
increases, the other decreases. Therefore the graph must have a negative slope, i.e. go down instead of up.
The graph below shows an inverse relationship.

Graphing variables to determine the relationship between them also allows unknown values to be discovered. When a line of best fit is used to connect the related data points, it can be assumed that the other, unmeasured points lie along it. This way unknown values can be interpolated (meaning from within the range of measured points) or extrapolated (meaning from outside of the range of measured points).
Tables
Tables are often a convenient form for the recording of data. Such a table should have column headings and units showing clearly what is recorded. The independent variable is recorded in the far left column and dependent variable to the right of that column. Make sure all data in any particular column is recorded to the same number of decimal places.
Qualitative data may also be recorded in table form.
Excerpt (with minor modifications) from Stanley, R.J, Reynolds, S, Baker, C & Coleman, H 2008, Book one, The Core, The elements of senior chemistry student workbook, The EnterprisePress, Adelaide.
Exercises
1 Retention factors (Rf values) are used in thin layer chromatography (tlc) to identify compounds.
(a) Explain how this is calculated.
(b) Give a source of random error in carrying out the measurements for an Rf value.
(c) For Rf values to be reliable, the same conditions must be used in an experiment as for the data
book value. List these five conditions.
2 (a) What is meant by using an 'internal standard' in paper chromatography or tlc?
(b) Why is using an internal standard considered to be more reliable in identifying compounds than
developing samples separately and comparing with Rf values from a data book?
3 Students in a Year 8 class were determining the boiling point of distilled water. Each student was
issued with an alcohol thermometer to measure the boiling point. (When mercury thermometers break
the hazard is far greater than when using an alcohol thermometer). The students recorded a range of
values from 980C to 104oC. Repetition of the experiment by each student with the same thermometer
gave the same result - e.g. a student who recorded 102oC before, got this value again. (a) Why?
(b) How could each student achieve a value closer to the true value (assuming that the atmospheric
pressure is one atmosphere)?
(c) What are possible sources of error in reading a thermometer which could lead to a range of
values in determining a boiling point?
4 Some students noticed that water which was the filtrate in a Buchner flask with the vacuum pump
operating was boiling at room temperature. Is this classed as a random or systematic error or neither?
Explain your answer.
Source : http://www.usc.adelaide.edu.au/local/transitionlectures/chemistry/measurement_and_data.doc
Web site link: http://www.usc.adelaide.edu.au
Google key word : Measurement Data Processing and Data Presentation file type : doc
Author : not indicated on the source document of the above text
If you are the author of the text above and you not agree to share your knowledge for teaching, research, scholarship (for fair use as indicated in the United States copyrigh low) please send us an e-mail and we will remove your text quickly.
Measurement Data Processing and Data Presentation
If you want to quickly find the pages about a particular topic as Measurement Data Processing and Data Presentation use the following search engine:
Chemistry
Measurement Data Processing and Data Presentation
Please visit our home page
Larapedia.com Terms of service and privacy page


